Color statistics
- See also

 Availability
 Previous
- Next

-
3x3.
M_PRINCIPAL_COMPONENTS returns the three eigenvectors columnwise in decreasing order of strength. The first eigenvector in the array is the strongest, and known as the first principal component. If no vector is stronger, the order is arbitrary.
-
4x3.
In addition to the 3x3 array results, MIL returns each eigenvectors's eigenvalue in the fourth column. The eigenvalue corresponds to the eigenvector's strength.
-
5x3.
In addition to the 4x3 array results, M_PRINCIPAL_COMPONENTS returns the mean color of the source image in the fifth column, band-by-band: SourceMeanValueBand0, SourceMeanValueBand1, and SourceMeanValueBand2.
You can call McolProject() to perform advanced statistical and analytical tasks, such as calculating the source image's covariance matrix or principal components, which are used in, for example, a principal component analysis (PCA). McolProject() can perform the calculation using the entire source image or specified areas of the source image.
Various conditions, such as different cameras and illuminants, can cause color from identical images to appear dissimilar. If this occurs, you can call McolTransform() to perform a relative color calibration before calling McolProject(). Relative color calibration ensures all colors are consistent according to a specified reference color. For more information, see the Relative color calibration section earlier in this chapter.
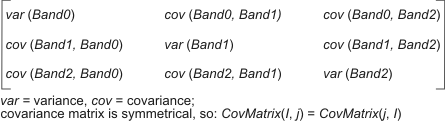
Covariance
If you use M_COVARIANCE, and you specify a 3x3 MIL array as the destination buffer, McolProject() calculates the following covariance matrix, which indicates the variation of color in the source image:
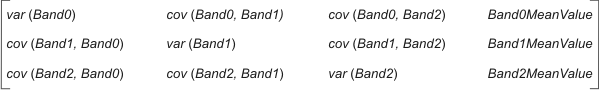
If you specify a 4x3 MIL array buffer, McolProject() also returns the mean color of the source in the fourth column.
Principal components
If you use M_PRINCIPAL_COMPONENTS, McolProject() performs a principal component analysis (PCA) to calculate the three principal components of the source image's color information. The three principal components correspond to the three eigenvectors of the image's covariance matrix. M_PRINCIPAL_COMPONENTS can also return each eigenvector's eigenvalue and the source image's average color. The information that M_PRINCIPAL_COMPONENTS returns depends on the size of the MIL array that you specify as the destination buffer:
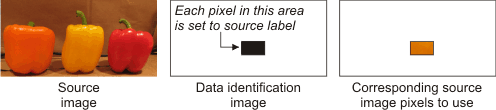
Source label
Instead of McolProject() using the entire source image to perform its calculations, you can identify specific source pixels to use. This allows you to isolate the areas of the image that contain the required colors and achieve more specialized results. To identify the areas in the source image with which to perform the calculation, you must specify another image, referred to as a data identification image. In this image, you must set the corresponding pixels to M_SOURCE_LABEL.