Matrox Profiler and trace logs
- See also

 Availability
 Previous
- Next

To analyze your application's execution, for debugging or optimization, you can generate a MIL trace log that contains information such as when each MIL function call in each thread starts and stops. Matrox Profiler is a utility that creates and graphically displays MIL trace logs. In addition to Matrox Profiler, there are MIL functions that can create or enhance trace logs.
Trace logs with Matrox Profiler
Matrox Profiler is a graphical tool that generates and graphically displays trace logs. It is accessible from the tools section of the MIL Control Center when running any Microsoft Windows operating system. When running Linux, you must use a different mechanism (discussed later) to generate the trace log and then you can use Matrox Profiler under a Microsoft Windows operating system to display the trace log.
Generating a new trace log with Matrox Profiler
When using Matrox Profiler to generate a new trace log, you must open the tool and start the log before you run the code that should be traced. To create a new trace log, choose Generate New Trace from the File menu of Matrox Profiler. You can also click on the New Trace icon or press Ctrl-N. The Trace Generation dialog box will appear, which you must keep open until the initialization of your MIL application (that is, a MIL application context has been allocated), although you can keep the dialog box open during the execution of your code.
In the Trace Generation dialog box, you can choose to save trace information to file or to memory. Allocating the trace log to memory has the advantage that it is faster than performing a trace to file. Another advantage is that, as long as either your application or Matrox Profiler is open, the memory in which the trace log is allocated will remain reserved for that purpose and the trace will continue. You could close Matrox Profiler, re-open it later, and pick up the same trace log to see the latest trace element (that is, the latest activity within your program). Alternatively, while keeping Matrox Profiler open, you can click on Reload at any time to see the latest activity in the trace log. This allows you to pick up the trace log in the middle of a program and evaluate it. The disadvantage of generating a trace to memory is that it is almost impossible to store the complete trace of your program within the allocated memory; at some point, the memory will get overwritten with the latest trace elements. When generating a trace to file, the name of the trace file includes the name of the application it traced, and has a .mtrace extension.
If you choose to generate a trace to memory, you can choose the type and size of memory in which to store the trace(s), or you can choose to use the default options. You can either choose to allocate the trace log in shared memory or non-paged memory (if the MIL non-paged memory manager driver has been installed; for more information, see the Advanced memory management section of Chapter 21: Data buffers). An advantage to allocating the trace log in non-paged memory is that, in the event of a crash, the trace can be recovered from the dump file generated by Windows (assuming that generating a kernel dump file upon a Windows crash has been enabled for your computer).
By default, Matrox Profiler tracks many types of program data. You can be more selective by clicking on the Select the types of elements to include in the trace button in the Trace Generation dialog box before running your application.
Note that when a MIL application context is initially allocated, MappAlloc() can be set to M_TRACE_LOG_DISABLE, which automatically disables the generation of any trace logs. Once disabled, Matrox Profiler will not be able to generate a trace log without you calling MappControl() with M_TRACE set to M_DEFAULT (or M_LOG_ENABLE if generating a trace log without Matrox Profiler). Disabling the automatic generation of a trace log with M_TRACE_LOG_DISABLE will help protect your intellectual property against reverse engineering.
Reading a trace log
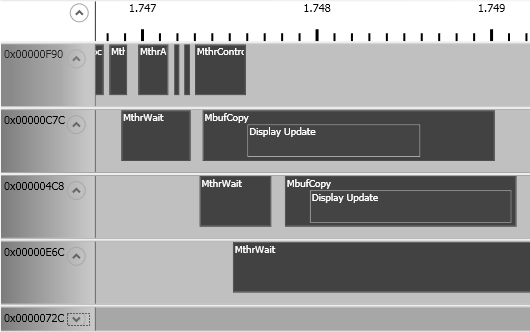
Once a trace log has been generated, it can be examined with Matrox Profiler by clicking on Load from the Trace Generation dialog box. This will bring you to the main Matrox Profiler window in which you can evaluate your trace-log. A trace log can display multiple concurrent threads, each with sequential function calls and other useful information, such as pop-up messages or MIL errors, all placed in a single time frame. The information is organized in stacks of rows, with each row representing a thread. In each row, there are blocks that represent function calls or other information. Within the blocks, there can be other blocks, such as display update blocks, as shown in the image below. These inner blocks are within a larger block because the inner blocks represent operations that are called by the outer block, and they start and stop within the time frame of the outer block.
The following image displays a trace log with five threads. The top row is the first thread that allocates the other four threads. The bottom thread is not being displayed since its display was toggled using the arrow next to the thread's name; collapsing blocks allows you to examine only the threads of interest.
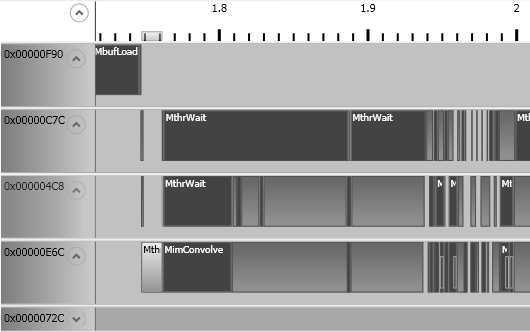
The time frame of the trace log is found above the top thread and is measured in seconds. You can zoom in or out, expanding or contracting the time frame, using the zoom buttons in the toolbar, or by scrolling with your mouse wheel. There could be many function calls that don't appear when viewed in one time frame, and then become apparent only when zooming in on an area; if you zoom out, they will disappear again. The following image displays the same trace log as above, only with a different time frame. Note the time frame has a different number of decimal places.
You can get additional information about a block by selecting it. The information includes the function call with the parameter values, the precise start and stop time for the function, and can include additional parameter details, such as a MIL_ID associated with the call. You can find this information at the bottom of the window. You can search for a particular function call or MIL_ID using the search pane on the right.
Trace logs without Matrox Profiler
To create a code-generated trace log without Matrox Profiler, you must enable tracing by calling MappControl() with M_TRACE set to M_LOG_ENABLE. A trace log will be generated from the point in your code that this call appears until the end of the application, or until you call MappControl() with M_TRACE set to M_LOG_DISABLE, whichever comes first.
The trace log is stored as a binary file that can only be read by Matrox Profiler. The trace log file is located in the %temp% directory.
Note that since the trace log is written to file, calls to MappControl() with M_TRACE set to M_LOG_ENABLE in your code will generate a new trace log file each time the code is run, which could fill your available storage unnecessarily.
Advanced trace log options
There are several MIL functions that can be helpful when generating a trace log with either Matrox Profiler or with MIL functions. These MIL functions allow you to limit the scope of the trace log to blocks of code, add user markers or sections that are read by the trace log, and get time stamps from MIL trace timer.
Trace logs in a multi-thread environment
By default, all threads in a multi-thread environment share the same global trace state, either enabled or disabled. If any thread calls MappControl() with M_TRACE, the global trace state is changed, which affects all threads equally.
If a thread calls MappControl() with M_TRACE + M_THREAD_CURRENT set to either M_LOG_ENABLE or M_LOG_DISABLE, the thread creates its own thread trace state. The thread trace state supercedes the global trace state for that thread. For example, if the global trace state for the application is currently set to disabled, but one thread has an independent thread trace state set to enabled, the trace log will only be filled with trace data from that one thread, leaving all other threads untraced.
When allocating a new thread using MthrAlloc() with M_THREAD or M_SELECTABLE_THREAD, you can choose to use the default initialization state or you can choose to disable the creation of trace logs (M_TRACE_LOG_DISABLE) for that thread. In effect this allows newly allocated traces to create an independent thread trace state. Once a thread has created its own independent thread trace state, it remains independent, regardless of changes to the global trace state. For example, if one thread calls MappControl() with M_TRACE + M_THREAD_CURRENT set to M_LOG_ENABLE, that thread will be traced. If afterwards any thread (including the independent thread) calls MappControl() with M_TRACE set to M_LOG_DISABLE, the thread with the independent thread trace state will remain enabled.
Once a thread has its own thread trace state, it remains independent until the thread calls MappControl() with M_TRACE + M_THREAD_CURRENT set to M_DEFAULT. This sets the thread trace state to the global thread state, and the thread is no longer independent.
Note that if the application has been set to disable all trace logs, and you allocate a new thread using MthrAlloc() with M_THREAD or M_SELECTABLE_THREAD which then calls MappControl() with M_TRACE + M_THREAD_CURRENT set to M_DEFAULT, even while running Matrox Profiler, nothing will happen because you have not enabled the global trace.
Trace-enabled/disabled blocks of code
By default, Matrox Profiler starts a trace upon the execution of your application and continues for the entire execution. However, your application can be configured to limit the trace to a block of code inside your application. You can create a block of code that is either trace-enabled, where only the code within the block will generate trace log data, or trace-disabled, where all your application code except that which is in the block will generate trace log data.
To create a trace-enabled block of code, which will generate trace data only for the code within the block, you must first disable the trace when you allocate your application context (MappAlloc() set to M_TRACE_LOG_DISABLE), and then call MappControl() with M_TRACE + M_THREAD_CURRENT set to M_LOG_DISABLE. Using MappControl(), set M_TRACE to M_DEFAULT. Then, you can create a trace-enabled block by calling MappControl() with M_TRACE + M_THREAD_CURRENT set to M_LOG_ENABLE at the start of the block and then call MappControl() with M_TRACE + M_THREAD_CURRENT set to M_LOG_DISABLE at the end. When you run Matrox Profiler, only the portion of the code inside the block will be logged.
Conversely, to keep a portion of your code from being traced while tracing the rest of your application, you can create a trace-disabled block of code. By default, Matrox Profiler will start tracing at the beginning of the application, so the first mention of the trace-disabled block is at the start of the block. At the start of the trace-disabled block of code, call MappControl() with M_TRACE + M_THREAD_CURRENT set to M_LOG_DISABLE and finish the block with MappControl() with M_TRACE + M_THREAD_CURRENT set to M_DEFAULT.
To determine if a thread is currently tracing a particular block of code, you can call MappInquire() with M_TRACE_ACTIVE. This inquire type will indicate whether the current thread is actively tracing (M_YES) the portion of code being executed or not (M_NO). This inquire type is recommended over using M_TRACE because it will return M_YES or M_NO as opposed to possibly returning M_DEFAULT.
When creating trace-enabled/disabled blocks of code for multi-threaded applications, you typically generate trace-enabled/disabled blocks for a specific thread using M_TRACE + M_THREAD_CURRENT. Specifying M_THREAD_CURRENT when starting or stopping trace log data generation will limit the trace-enabled/disabled block of code to the thread that called it. All other threads will continue to generate or not generate trace log data, based on the global trace state. However, if you specify only M_TRACE, when a enabled/disabled block is entered, data will be logged or disabled for all threads that do not have an independent thread trace state, regardless of which thread specified the enabled/disabled block.
Trace markers
You can fine tune the trace log data, regardless of whether the log was generated using Matrox Profiler or with MIL functions. MappTrace() helps identify important pieces of code by creating a marker or section near or surrounding your code. Place MappTrace() next to a piece of code that needs attention. You can also create a section by calling MappTrace() twice, once before the code to observe, and once after it, setting TraceType to M_TRACE_SECTION_START and M_TRACE_SECTION_END, respectively. You can identify the marker or section by passing MappTrace() a tag (a unique value). Once the trace log is generated, you will be able to search for the markers and sections you created.
For each marker or section, you can also specify a value or string to associate with it, using TraceValue and/or TraceString, respectively. Typically, these values would relate to the code that the marker or section identifies, such as a return value, intermediate result, or some other relevant value or string.
You can also add additional information to the trace tag by setting TraceType to M_TRACE_SET_TAG_INFORMATION. This allows you to set a name and/or a color to associate with a particular trace tag. All trace markers or sections that have the same tag will have the same name and/or color associated with it.
Advanced memory tracing
In the Generating a new trace log with Matrox Profiler subsection of this section, it was discussed that one of the disadvantages of generating traces to memory is that it is almost inevitable that the reserved memory will be filled at some point and get overwritten with newer data. To evaluate sections of code that are of particular interest, you can choose to save that particular portion of the trace to file using M_TRACE_SAVE_TO_FILE. This control type will copy the contents of the trace memory into an .mtrace file which can then be used with Matrox Profiler. This is useful when you are trying to debug a particular segment of your application. As has been previously discussed, the trace file will only contain the most recent trace elements and not the complete application due to the limitations of tracing to memory.
User-defined trace log
You can create your own user-defined trace log, which you can compare to the trace log created with Matrox Profiler. One way to do this is to hook a user-defined function to MappHookFunction() with HookType set to M_TRACE_START or M_TRACE_END. To compare your user-defined trace log with the trace log created with Matrox Profiler, it can be useful to add time stamps to your user-defined trace log. Insert these time stamps in your code using MappTimer() with M_TIMER_READ + M_TRACE. Note that Matrox Profiler uses MappTimer() with an M_TRACE timer to generate its internal time stamps.
Generating a new trace log under Linux
Matrox Profiler is a tool used to create and read trace logs, but it only functions in a Microsoft Windows environment. Under Linux, there is another tool to create the trace logs, but you will still need to run Matrox Profiler in Windows to read the trace log.
To create a MIL trace log under Linux, open the MILConfig utility. From there, there is an option called MIL Profiler trace. When selected, click on the Start interactive trace button in the presented dialog. A Trace Generation dialog box appears. This dialog box instructs you to run your code while the dialog box is open. While the dialog box is open, and the code is running, a trace is generated. When you either close the dialog or terminate your running program, the trace log stops being generated and is saved in a directory whose path appears in the MILConfig utility screen.
Using Matrox Profiler in a Distributed MIL environment
When tracing a Distributed MIL cluster, you can generate trace logs, but each computer, local and remote, must run its own instance of Matrox Profiler. Each computer will generate its own trace log and will collect information specific to itself only. Note that asynchronous functions called from the local computer, but run on a remote computer, will appear to have a very short duration. This does not represent the time taken to run the function, but only the time taken to offload the function to the remote computer. The duration of that function would appear in the trace log of the remote computer on which it was run.
Interactive log
While troubleshooting with Matrox technical support, you might be instructed to create an interactive log, which contains a trace log. From the MILConfig utility, click on the Troubleshooting tab and then click on the Start Interactive log button. This opens a dialog box that instructs you to run your code while the dialog box is open. While the dialog box is open, and the code is running, an interactive log is generated. When you either close the dialog box or terminate your running program, the interactive log stops being generated and is saved in a directory whose path appears in the MILConfig utility.
The result of running an interactive log is a Sysinfo file. This Sysinfo file cannot be read by Matrox Profiler and should be sent to Matrox for troubleshooting. Note that to limit the tracing information contained in the interactive log, you should create a block of code that is either trace-enabled, where only the code within the block will generate trace log data, or trace-disabled, where all the code except within the block will generate trace log data. For information on these code blocks, see the Trace-enabled/disabled blocks of code subsection of this section.
You should use Matrox Profiler and optionally a user-defined trace log for your own tracing needs.