Drawing graphics
There are multiple ways to annotate an image. The functions provided by the MIL Graphics module allow you to draw graphics of geometric shapes or text. The M...Draw() functions of processing and analysis modules allow you to draw module-specific features into your image.
With the functions provided by the MIL Graphics module, you can draw the outline of most shapes. The width of a line forming a graphics outline (including lines and dots) is always one pixel; however, when zooming graphics drawn in an image, the outline size can appear bigger. Graphics can be rotated, filled, and drawn multiple times.
|
Examples of MIL graphics |
|||
|
|
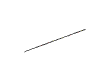
MgraLines() with M_POLYLINE |
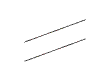
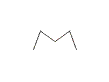
MgraLines() with M_POLYGON |
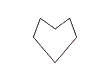
MgraLines() with M_POLYGON + M_FILLED |
|
|
MgraArcAngle() with M_CONTOUR |
MgraArcAngle() with M_SECTOR |
|
|
|
MgraRectAngle() with M_FILLED |
|
|
|
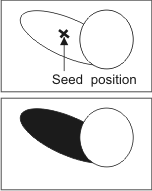
If you need complex filled-in shapes, you can draw a graphic's outline (using one of the Mgra...() functions) and use MgraFill() to fill it. MgraFill() performs a boundary-type seed fill. It fills an area of the target buffer with the current foreground color, starting from the specified seed position. Filling occurs on adjacent pixels of the same value as the original seed pixel.
Note that text is a unique type of graphic. For more information, see the Writing text section later in this chapter.
Processing and analysis modules (such as Bead or Edge Finder) have a function that can draw specific settings or results into an image buffer or graphics list. Each draw function (M...Draw()) can draw into an image buffer without restriction, but some restrictions exist when drawing in a graphics list.
When drawing a graphic in an image buffer, it is drawn destructively (raster-based), changing the image's pixel values along the specified graphic. Instead of destructively drawing the graphic in an image, you can also use the same function to add the graphic to the graphics list and annotate the display non-destructively. For more information, see the Graphics list section later in this chapter.
Drawing graphics in a calibrated image
When a graphic is drawn, position, dimension, and angle information is interpreted according to the unit of measurement set using MgraControl() with M_INPUT_UNITS. If part of the graphic falls outside of the specified image buffer, that part is clipped off.
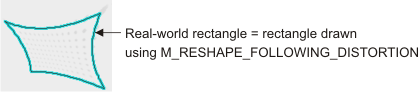
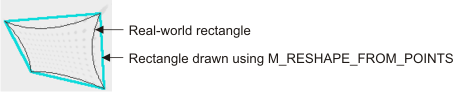
A graphic defined in world units does not necessarily respect the graphic shape when viewed in pixel units, if there is distortion. For example, a straight-edge rectangle in world units might have arced edges when converted to pixel units due to spatial distortion. There are three different ways to manage graphic conversion from world to pixel units when distortion is present. To draw the graphic following distortion, the graphic can be converted respecting the calibration information exactly using MgraControl() (or MgraControlList()) with M_GRAPHIC_CONVERSION_MODE set to M_RESHAPE_FOLLOWING_DISTORTION. Alternatively, MIL can convert only the graphic's key points or features (for example, intersection-points, center-point or radius) using the calibration information, with M_GRAPHIC_CONVERSION_MODE set to M_RESHAPE_FROM_POINTS; the remainder of the graphic is drawn from these points, ignoring any non-linear distortion. This is the default mode. It is the fastest and is acccurate as long as there is only linear distortion. If you require a dot or straight-edge rectangle with 90 degree angles drawn, ignoring all distortion, use M_GRAPHIC_CONVERSION_MODE set to M_PRESERVE_SHAPE_AVERAGE.

Drawing graphics with offset and zoom
Using MgraControl() with M_DRAW_OFFSET_X and M_DRAW_OFFSET_Y, you can offset the position of graphics in the destination image by a specified amount in pixels. The offset values are subtracted from the specified position of the graphic when it is rendered (because you are specifying where the old location is with respect to the new location). In addition, using MgraControl() with M_DRAW_ZOOM_X and M_DRAW_ZOOM_Y, you can have a graphic appear zoomed when rendered. The specified zoom factors will enlarge or shrink the apparent dimensions of a graphic in the X- and Y-direction.
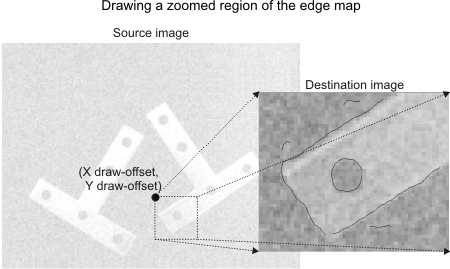
Any portion of a graphic that fall outside of the destination image when offset or zoomed is not drawn. This is particularly useful when drawing the results of a processing or analysis operation, using most of the M...Draw() functions. This allows you to draw a subset of positional results and settings (for example, the edge map of a region of an image) at a required magnification and starting from a required location in a destination image. For example, the following image shows the edge map of a region of a source image, beginning at the point (X draw-offset, Y draw-offset) in the source image's coordinate system, and being drawn and zoomed by a factor of 3 in both X- and Y- directions, in a destination image buffer using MedgeDraw().
M_DRAW_OFFSET_... and M_DRAW_ZOOM_... are also useful to draw results, obtained from a child buffer, as if they were obtained from an operation on its parent buffer. For example, the following image shows results obtained from a child buffer drawn in a parent buffer, with and without offset.
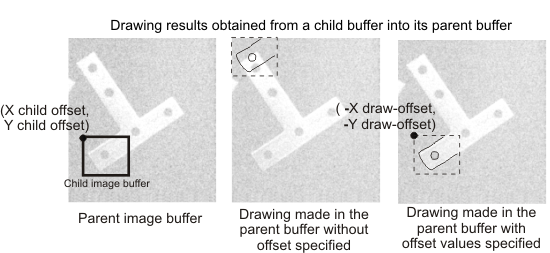
Since the offsets are subtracted from the position at which to draw in the destination, this example requires M_DRAW_OFFSET_... be set to negative values to draw the edges at the right location in the destination image.