Image statistics
- See also

 Availability
 Previous
- Next

-
Generate the intensity histogram of an image buffer (MimHistogram()).
-
Calculate a variety of general statistics for all pixels in an image that satisfy a specified condition (MimStatCalculate()).
-
Calculate and accumulate a variety of general statistics for all pixels in a series of specified images (MimStatCalculate()).
-
Find the minimum and maximum values of an image buffer (MimFindExtreme()).
-
Find the location of certain pixel values (MimLocateEvent()).
-
Find the number of differences between two image buffers (MimCountDifference()).
-
Perform an image projection from two dimensions to one dimension (MimProjection()).
-
Calculate the integral of an image (MimArith()).
-
Maximum pixel value.
-
Maximum absolute pixel value.
-
Mean pixel value.
-
Minimum pixel value.
-
Minimum absolute pixel value.
-
Number of pixels (that satisfy the condition).
-
Standard deviation value.
-
Sum of pixel values.
-
Sum of absolute pixel values.
-
Sum of squared pixel values.
-
The coherence of the unit vectors.
-
The dominant angle of the unit vectors.
-
The dominant orientation of the unit vectors.
-
Maximum pixel value at the position.
-
Maximum absolute pixel value at the position.
-
Mean pixel value at the position.
-
Minimum pixel value at the position.
-
Minimum absolute pixel value at the position.
-
Number of pixel values, at the position, that match the given condition.
-
Standard deviation value at the position.
-
Sum of pixel values at the position.
-
Sum of absolute pixel values at the position.
-
Sum of squared pixel values at the position.
Many applications need to obtain some type of image statistic to condense a frame of pixels into a smaller, more functional set of values for analysis. The statistic might be required to perform some subsequent operation and/or might be used to summarize the effect of some image operation. The MIL Image Processing module offers a variety of functions to extract statistical information from an image. These functions allow you, for example, to:
Note that, with the exception of MimHistogram(), these functions are not available with MIL-Lite.
Generating a histogram
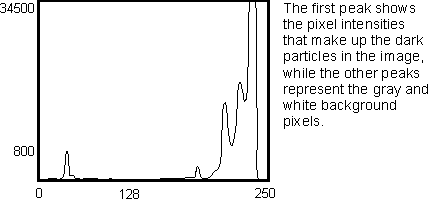
A histogram is the intensity distribution of pixel values in an image and is generated by counting the number of times each pixel intensity occurs. Histograms store this information in bins, each of which represents an intensity. For example, if a histogram has 100 bins, it can represent 100 intensities.
Information about the intensity distribution of pixel values in an image is useful for several applications. In particular, it is useful to help select a threshold level when binarizing an image (discussed later) and to change the image intensity distribution when trying to increase the image contrast.
You can generate an image histogram using MimHistogram(), which takes an image buffer and stores the results in a previously allocated histogram result buffer. To allocate the result buffer, use MimAllocResult() with M_HIST_LIST. Ensure that you specify enough histogram bins to store the required number of intensities in the result, using the NbEntries parameter. For example, if you are using an 8-bit unsigned source image, and you want to have one bin for every possible intensity value, you should specify 256 entries.
To read results, use MimGetResult(). Once results have been read from the result structure, you can then release it, using MimFree().
If you require further control over the generated histogram, you can specify the number of values that a histogram bin can hold, using MimControl() with M_HIST_BIN_SIZE_MODE, before calling MimHistogram(). You can also apply a smoothing factor to the histogram with the M_HIST_SMOOTHING_ITERATIONS control. Since the smoothing is an integer-based averaging of the histogram, the resulting number of values might be different than the number of values in the source image. To retrieve this type of information, use MimGetResult() with M_HIST_REAL_SIZE, M_HIST_VALUE_OFFSET, and M_HIST_VALUE_RANGE.
The following example shows how to load an image, and calculate and draw its intensity histogram.
You can use the MIL graphics functions to plot the histogram results on a graph, as shown below. The graphics functions (Mgra...()) are discussed later in this manual.
Calculating general statistics
You can calculate various statistics for all pixels that satisfy a specified condition in an image, using MimStatCalculate(). Setting the condition limits the number of pixels for which the statistics will be calculated. However, the condition can also be set to use all of the pixels in the image.
The types of statistics that can be calculated include the following:
Note that MimStatCalculate() stores results in a result buffer that should have been previously allocated, using MimAllocResult() with M_STATISTICS_RESULT.
Alternatively, you can use MimProjection() to calculate the maximum, minimum, mean, and median pixel value for each row or column of pixels in the image. This is typically more efficient than using MimStatCalculate() when you need to calculate these statistics for regions of an image that are rows or columns of pixels, and calculate them for all rows or columns in that region. When you need to calculate statistics for regions of an image that are not rows or columns, or individual rows or columns, use MimStatCalculate(). For more information on using MimProjection() to calculate the maximum, minimum, mean, and median pixel value for each row or column of pixels in the image, see the Projecting an image to one dimension subsection of this section.
Considering pixel values as unit vectors and calculating angular statistics
If pixel values in your image represent angles instead of intensities, you can also choose to have MIL treat the pixels as unit vectors, where the angular value of a pixel is considered to be the angle of a vector with a length of one. Treating the pixels as unit vectors allows MIL to calculate directional statistics, which take into account the wrap-around characteristic of angles (so that, for example, the mean of 0 and 360 is either 0 or 360, not 180). This is useful, for example, when calculating color statistics of HSL images because the hue of an HSL image is measured on an angular scale, as opposed to a linear scale.
The angles are considered to have been scaled to the type of the image buffer. For unsigned buffers, the minimum pixel value is considered as an angle of 0, and one plus the maximum possible pixel value is considered an angle of 360. For example, an 8-bit buffer would have 0° mapped to a value of 0, while 360° would be mapped to a value of 256 (since the maximum pixel value is 255). For signed buffers, the minimum pixel value is considered as an angle of -180° while one plus the maximum pixel value is considered as an angle of 180°. Floating point buffers have intensity values anywhere between 0 and 1, and these values are linearly mapped between 0° and 360°.
Using MimStatCalculate(), there are three main statistics that can be calculated when pixel values that satisfy a specified condition are considered as unit vectors:
Coherence
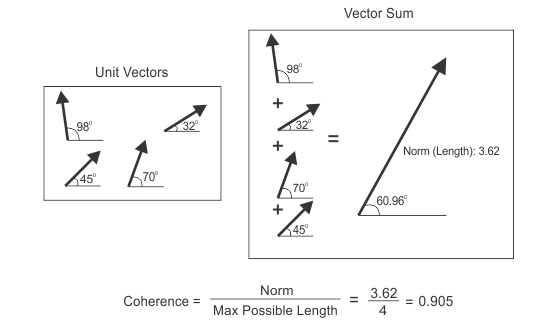
The coherence represents the directional trend of all the unit vectors in the image. It is a measure of how coherent or parallel the unit vectors are with respect to each other. To quantify this idea, MimControl() with M_STAT_ANGULAR_DATA_COHERENCE enables a vector addition on all the unit vectors. This is performed when MimStatCalculate() is called. The vector that results from this addition is known as the vector sum, and the length component of this vector sum is known as the norm. The function then calculates the ratio between the norm, or length, of the vector sum and its maximum possible length (which corresponds to the number of pixels considered, since each pixel is presumed to have a length of one). Numerically, this quantity lies between 0 and 1, where 0 represents absolutely no coherence (unit vectors pointing in random directions) and 1 is total coherence (unit vectors pointing in same direction). Below are images depicting three different coherences: perfect coherence, high coherence, and low coherence, respectively.
In the following image, the coherence of 4 unit vectors with the same angle is calculated. Since the ratio between the norm and the maximum possible length is equal to 1, there is total coherence between individual unit vectors, confirming all unit vectors are pointing in the same direction.

In the following image, the coherence of 4 unit vectors with differing angles is calculated. Since the ratio between the norm and the maximum possible length is equal to 0.905, there is high (but not total) coherence between individual unit vectors. Therefore, it can be concluded that the unit vectors are pointing in similar directions.
In the following image, the coherence of 4 unit vectors with differing angles is calculated. Since the ratio between the norm and the maximum possible length is equal to 0.105, there is very low coherence between the individual unit vectors. Therefore, it can be concluded that the unit vectors are pointing in seemingly opposite or random directions.

Dominant angle
In addition to calculating the coherence (M_STAT_ANGULAR_DATA_COHERENCE), by treating the pixels as unit vectors, you can also calculate the dominant angle in the data. To do so, use MimControl() with M_STAT_ANGULAR_DATA_MEAN before calling MimStatCalculate(); this considers the angular component of the vector sum as the average angle. When the average angle is analyzed in context with the coherence of the unit vectors, it is much more representative of the average angle. For example, if your image has a coherence of 0.1 and an average angle of 65°, the average angle is not very meaningful because the unit vectors are pointing in random, incoherent directions. However, if your image has a coherence of 0.9 and an average angle of 65°, this indicates that the unit vectors are more or less pointing in the same direction, and their average value is around 65°.
Dominant orientation
If you are only interested in the dominant orientation of the unit vectors, you should enable MimControl() with M_STAT_ORIENTATION_DATA_MEAN before calling MimStatCalculate(); this only takes into consideration the inclination of the unit vectors, without their direction, returning their dominant orientation within the image (for example, are they horizontal, vertical, diagonal). For unit vectors that are antipodal to each other (for example, 45° and 225°), the resulting orientation angle will be one of the original angles (for the previous example, 45°). Whereas for unit vectors that have an angular distance of 90° (for example, 0° and 90°), the vectors will cancel each other out. The orientation operation does not typically deal with only 2 unit vectors, but with all unit vectors within an image; as such, it is very unlikely that all the resulting unit vectors' orientations will cancel each other out. Furthermore, because the operation deals with the average orientation of all unit vectors in an image, the approximate, dominant orientation of the image is returned. For a more accurate orientation operation, use the MimFindOrientation() function.
The following image illustrates the difference between taking the dominant angle (M_STAT_ANGULAR_DATA_MEAN) and the dominant orientation (M_STAT_ORIENTATION_DATA_MEAN). The calculation of M_STAT_ANGULAR_DATA_MEAN results in a dominant angle of 45 o . Whereas, the calculation of M_STAT_ORIENTATION_DATA_MEAN results in a dominant orientation of 90 o .

Calculating statistics across multiple images
You can calculate statistics for each pixel location across multiple source images, passed upon iterative calls to MimStatCalculate(). One value is calculated for every pixel in the source image, for each statistical operation specified to be performed. This function stores results in a result buffer that should have been previously allocated using MimAllocResult() with M_STATISTICS_RESULT. The same result buffer should be specified for each call to MimStatCalculate().
Specify the statistics to perform using a multiple statistics image processing context, allocated using MimAlloc() with M_STATISTICS_CUMULATIVE_CONTEXT. Enable the type of statistics to calculate using MimControl() with one or more of the statistics (for example, set M_STAT_MEAN to M_ENABLE).
You can limit some of MimStatCalculate() 's results to a region of an image buffer using a region of interest (ROI) set using MbufSetRegion(). The ROI must be defined in raster format (M_RASTER or M_VECTOR_AND_RASTER). An error is generated if the ROI is only in vector format (M_VECTOR). If you specify multiple image buffers with an ROI, results are limited to the portion of the ROIs that intersect. Note that not all statistics operations support ROIs; for a list of those that do, see MimControl().
MIL can calculate one or more of the following types of statistics for each pixel position in the sequence of images:
When you are ready to calculate the statistics for the source images, you must preprocess the context and result buffer. The preprocessing stage uses the specified source image and result buffer (if specified) to determine how to optimally calculate the specified statistics. If the preprocessing operation was not done explicitly (using M_PREPROCESS) it will be done when MimStatCalculate() is first called. Note that, if you do not provide a source image for the preprocessing operation, you must set M_SOURCE_SIZE_X and M_SOURCE_SIZE_Y to respective width and height of a typical image.
Finding the image extremes
You can find the minimum and maximum pixel values of your image with MimFindExtreme(). Perhaps the most common use for finding the minimum and maximum image pixel values is to fine-tune the black and white reference levels of your frame grabber, ensuring full-range digitization. Another use for finding the maximum image pixel value is to find the number of objects in a labeled image. If all objects in an image are labeled with unique consecutive values, using MimLabel() (discussed later in this chapter), the largest label value also corresponds to the number of objects in your image.
MimFindExtreme() stores results in a result buffer that should have been previously allocated, using MimAllocResult() with M_EXTREME_LIST. You can get the resulting values, using MimGetResult(), and free the result buffer, using MimFree().
Locating events
Once you have established certain values of interest in an image, you can find the location of pixels that satisfy conditions based on these values, using MimLocateEvent(). For example, you can use MimLocateEvent() to find the location of all pixels in an image equal to the image's maximum pixel value.
Note that MimLocateEvent() stores results in a result buffer that should have been previously allocated, using MimAllocResult() with M_EVENT_LIST.
Counting image differences
You can find the number of differences between two images, using MimCountDifference(). MimCountDifference() stores results in a result buffer that should have been previously allocated, using MimAllocResult() with M_COUNT_LIST. You can get the resulting values, using MimGetResult(), and free the result buffer, using MimFree().
Projecting an image to one dimension
The MimProjection() function projects an image onto one dimension, based on a specified projection axis angle and operation. The projection operates on all pixel values along each lane of pixels in the image perpendicular to the specified axis angle (for example, a 90° angle projects each row onto the Y-axis).
You can use MimProjection() to calculate the maximum, minimum, mean, or median pixel value for each lane of pixels in the image. Although you can calculate the maximum and minimum pixel values for a lane using MimStatCalculate(), it is more efficient to use MimProjection() when you need to get these values for all lanes in an image. In this case, use MimProjection() with M_MAX, M_MIN, M_MEAN, or M_MEDIAN.
Another operation that MimProjection() supports is summation (M_SUM). In this case, it sums all pixel values in each lane. This projection is referred to as the pixel value density of each lane of pixels. The 90° projection of the image is known as the row profile, and the 0° projection is known as the column profile.
The MimProjection() function can perform both grayscale and binary image summation projections. On simple binary images, the projection is useful to detect object locations. The following image demonstrates the row and column profiles for a binary image, as calculated using MimProjection() with M_SUM.

You can use MimProjection() with a destination image buffer, or you can use a result buffer allocated using MimAllocResult() with M_PROJ_LIST. Writing results to a projection image processing result buffer allows you to manipulate results using an array once you have retrieved the results using MimGetResult() or MimGetResult1d(). You should define a result buffer with as many locations as there are lanes of pixels in the image, perpendicular to the specified axis angle.
When using a region of interest in the source image of your projection, lanes of pixels that fall outside the specified region of interest will be marked as invalid in the result buffer. You can retrieve the validity of projection data for each lane using MimGetResult() or MimGetResult1d() with M_VALID. Note that for an M_SUM projection operation, if a lane of pixels does not contain valid projection data, a neutral pixel value of 0 is used for that lane. In this case, M_VALID will indicate valid projection data for all lanes of pixels in the image.
Calculating the integral of an image
You can calculate the integral of an image, using MimArith(). Each pixel of the integral image contains the cumulative sum of the source image pixels until that location. Calculating the integral of the image allows you to analyze regions of an image more efficiently. For more information on calculating the integral of an image, see Computing the integral of an image.